
Brockton Multi-Family Market Compared with Nearby Cities
February 5, 2026
February 5, 2026
Thinking about a 2–4 unit in Brockton but wondering if Plymouth, Taunton, Fall River, New Bedford, or even Boston would fit your numbers better? You are not alone. Small multi-family buyers often face tight budgets and fast-changing rents, so picking the right city matters. In this guide, you will see how Brockton stacks up, what to compare before you buy, and where nearby markets can offer better price, rent, or risk balance. Let’s dive in.
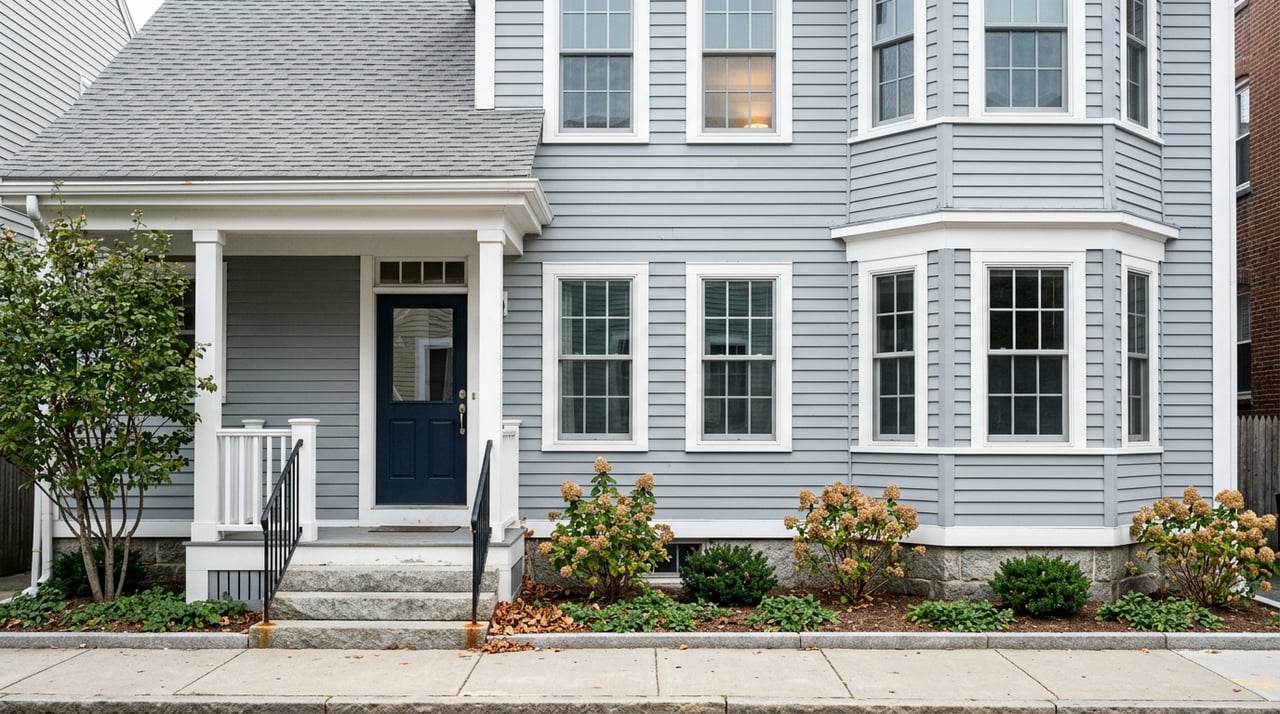
Brockton has long been a regional hub with a meaningful stock of duplexes and triple-deckers. That means you will usually find more options in the 2–4 unit range than in some suburban towns. Entry prices tend to be lower than Boston, which helps owner-occupant buyers use financing to control housing costs and build equity.
Rental demand is supported by a sizable renter base and commuter access. MBTA Commuter Rail service connects Brockton to Boston, and highways like Route 24 and Route 27 support regional commutes. That combination often translates to steady interest from renters who work in Boston or nearby job centers. For transit context, review MBTA’s Commuter Rail system to see schedules and station coverage.
The trade-off is age and condition. Many properties are older wood-frame structures. You will want to plan for inspections, possible system updates, and code compliance. This older stock can be an opportunity if you budget correctly, but it can also add time and cost to your plan.
Use the comparisons below to decide where your goals fit best. Markets can change quickly city by city, so confirm current pricing and rents before you write an offer.
Plymouth is more suburban and coastal. The housing mix skews toward single-family, so 2–4 unit inventory is limited. When a small multi-family hits the market, per-unit pricing may be higher because the broader buyer pool is anchored by single-family values. Rental demand is present but more seasonal in feel than urban markets. Expect fewer options and slower turnover in the small multi-family segment.
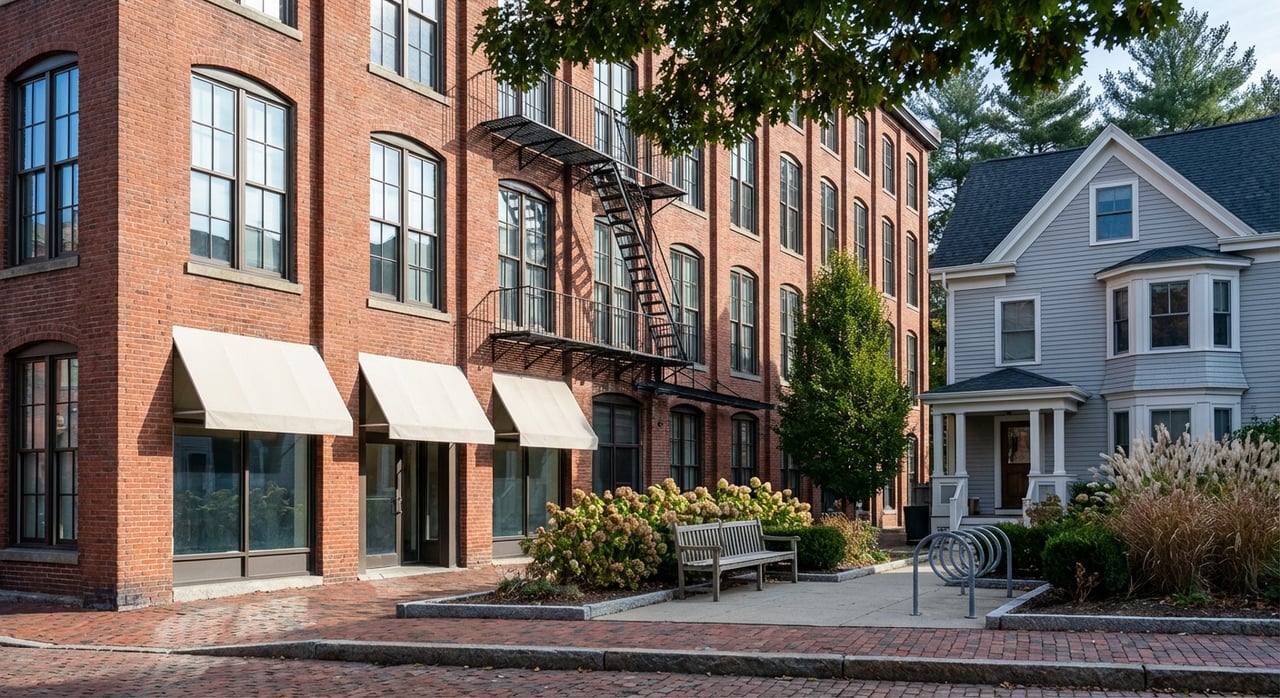
Taunton is an older mill city with a meaningful supply of duplexes and triple-deckers. Entry prices are often competitive compared with Brockton. Rents can be solid for the region, but appreciation trends and tenant turnover can vary by neighborhood. Investors who underwrite carefully and focus on condition, rents, and management can find workable cap rates.
Fall River offers a large inventory of older multi-family buildings and can present lower entry prices than Brockton. Rents may also be lower, so your cap rate can hinge on renovations and management. Expect more neighborhood-by-neighborhood variation. For patient buyers willing to improve units and control expenses, the numbers can work.
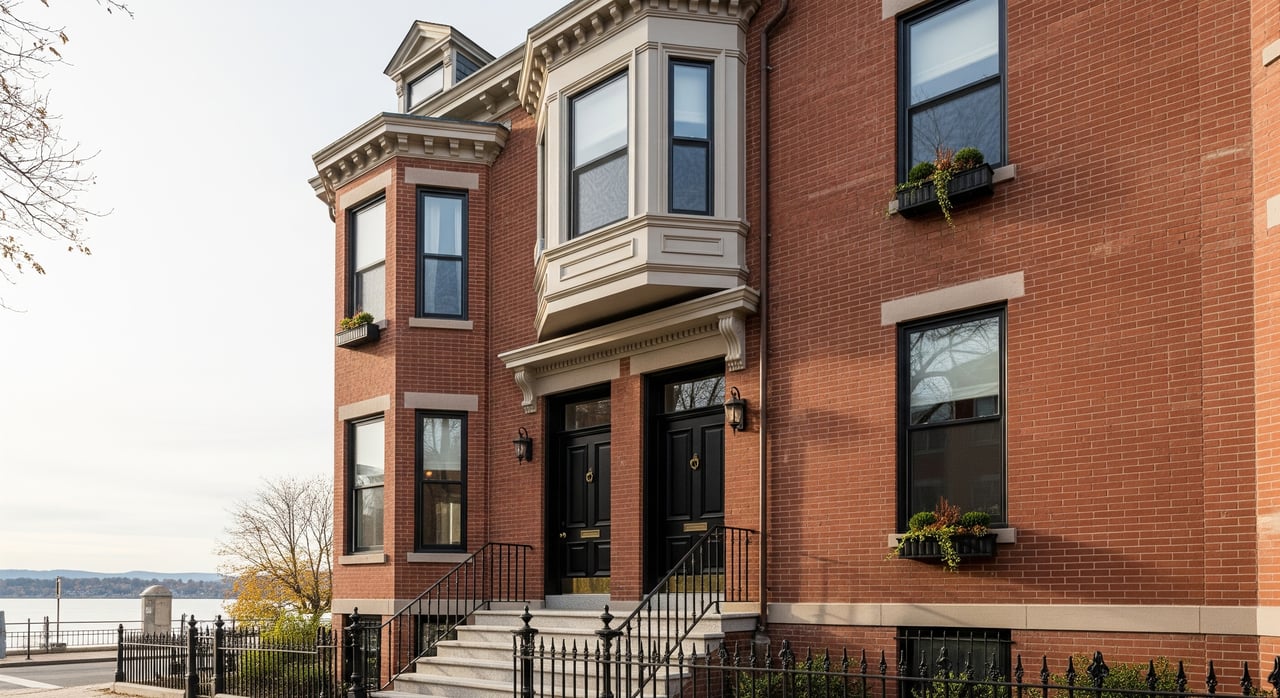
New Bedford mirrors Fall River in many ways, with a deep stock of triple-deckers and small brick buildings. Initial purchase prices can look attractive, though rent levels and appreciation have historically been more moderate. The upside often comes from thoughtful repositioning and stable, long-term management.
Boston is the regional anchor and the most expensive market. 2–4 unit opportunities exist but are scarce and heavily competed over. Rents are strong and vacancy is low, yet pricing often pushes returns toward appreciation rather than immediate cash flow. Investors here typically prioritize long-term value and location over yield.
If you compare cities side by side, focus on these essentials. Small changes in each one can swing cash flow and returns.
Here is a simple framework you can apply to any market side by side.
Pricing and supply
Rent and demand
Operating costs
Transit and commute
Regulations
Use simple, consistent math to compare properties across cities.
Gross Rent Multiplier (GRM)
Net Operating Income (NOI)
Cap rate
Cash-on-cash return
If you plan to owner-occupy a 2–4 unit, review FHA and conventional rules. FHA allows owner-occupant financing for 2–4 units if you live in one unit. For program details, start with HUD’s Single Family resources, and confirm terms with a local lender. County-level rent benchmarks are on the HUD Fair Market Rents page.
Before you write an offer, confirm these items so your numbers stay tight.
Rental licensing or inspections
Transit patterns
Insurance and rehab
Neighborhood-level comps
For broader context on labor trends, consult the BLS Local Area Unemployment Statistics. For renter share and income patterns, use the U.S. Census Bureau’s data portal.
Choose Brockton if you want a deeper pool of 2–4 unit options, commuter access, and pricing that is generally lower than Boston. You may face more upfront work on older buildings, but a solid rent base and strong transit links can support long-term demand.
Consider Plymouth if you want a more suburban setting and are comfortable with fewer small multi-family listings. Look to Taunton, Fall River, or New Bedford if you value lower entry prices and are ready to be hands-on with renovations and management. Choose Boston if your strategy prioritizes location and long-term appreciation over immediate yield.
Build a quick comparison for two or three target cities using the steps above. Price out your down payment, closing costs, and first-year repairs. Run GRM, cap rate, and cash-on-cash on at least three real listings in each city. Then, shortlist the city that fits both your budget and your tolerance for renovations and management.
When you want local comps, rent roll guidance, and an offer strategy that lands the right building, connect with a hands-on agent who does multi-family every week. If you prefer support in English, Spanish, or Portuguese, and want help coordinating lenders, inspectors, and closing, reach out to Luis Rodrigues for a free consultation.

Fall River Multi-Family Homes for Sale
Luis is here to help you throughout your entire home buying and selling process. Trying to do it all on your own can be burdensome. He will find you homes within your price range, help you find buyers, assist you with paperwork, and more.